Financial Information
Management Index Data
If you want to know in more detail, please refer to Investors' Data Book 2025.
Financial Highlights (Consolidated)
Note) Figures are rounded down in principle.
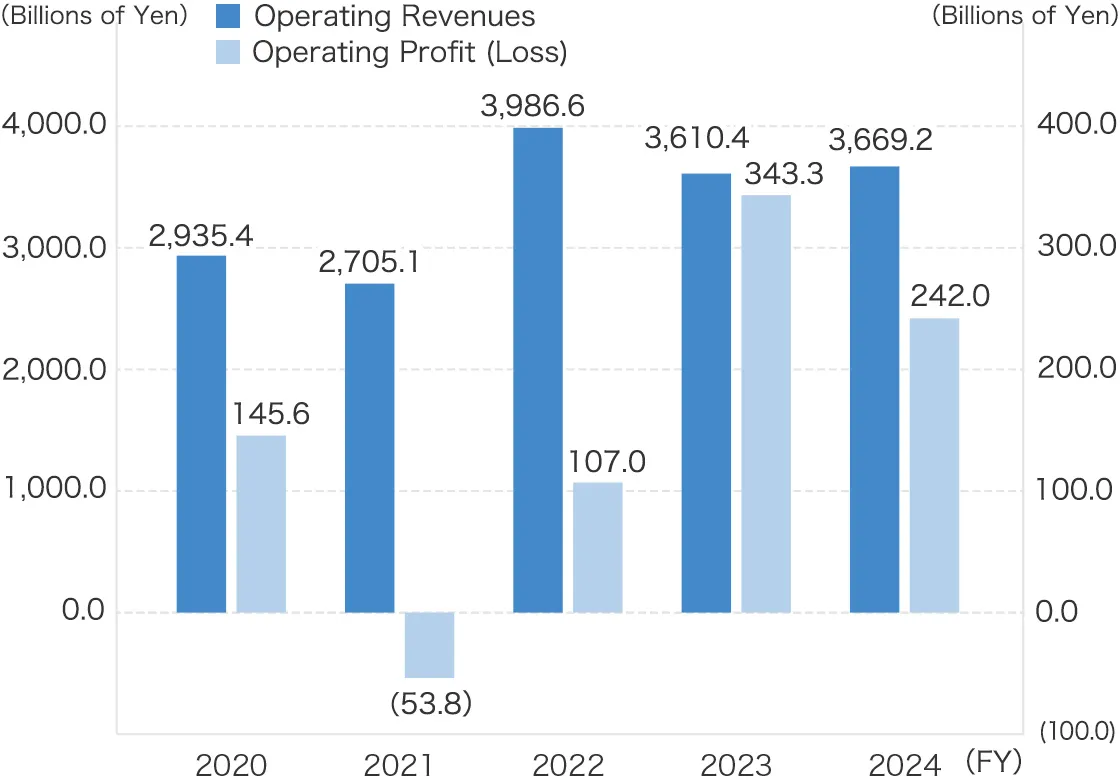
| Operating Revenues / Operating Profit (Loss) |
|---|
|
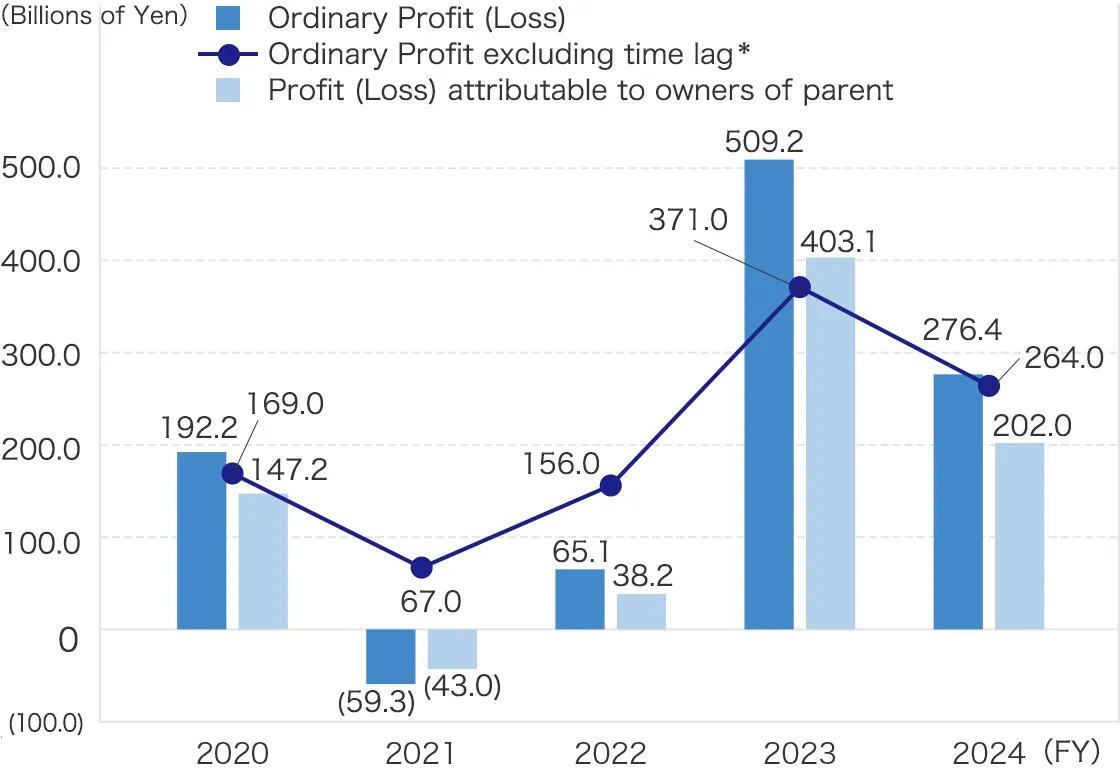
| Ordinary Profit (Loss) / Ordinary Profit excluding time lag / Profit (Loss) attributable to owners of parent |
|---|
|
*Ordinary Profit excluding time lag : Approx. Billions of Yen.
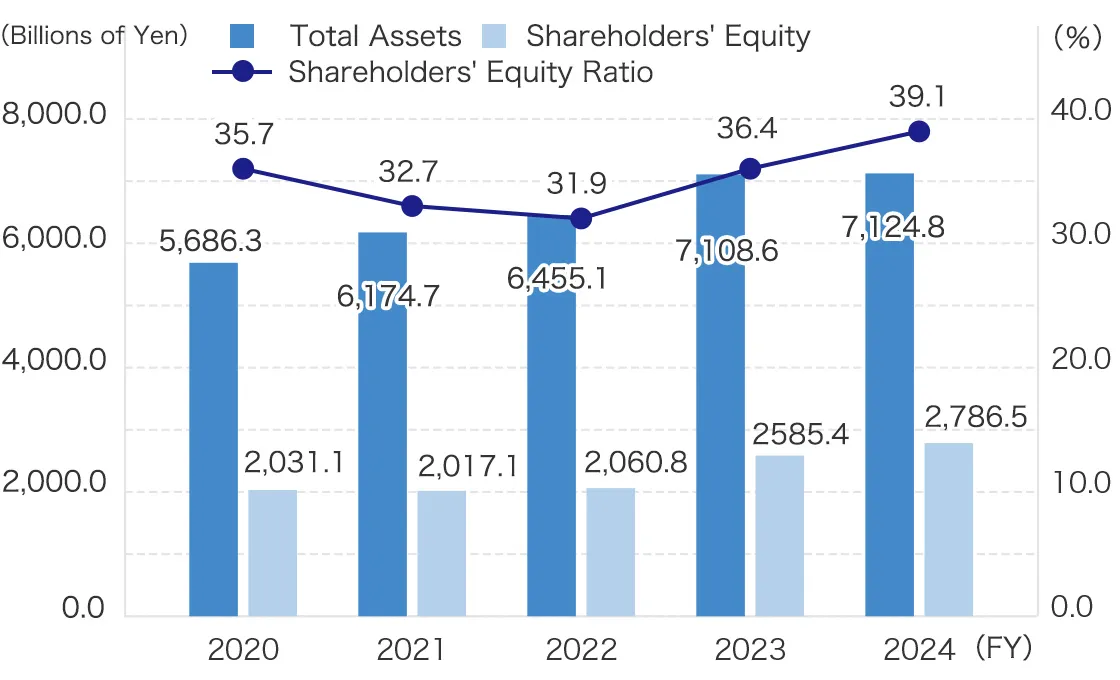
| Total Assets / Shareholders' Equity / Shareholders' Equity Ratio |
|---|
|
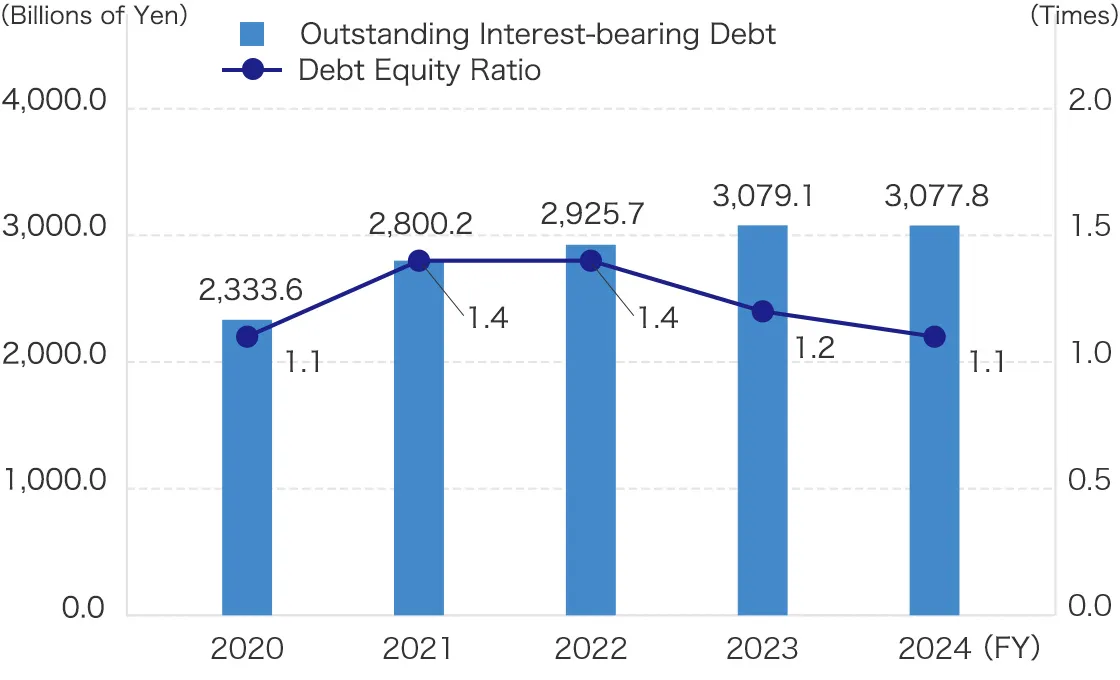
| Outstanding Interest-bearing Debt / Debt Equity Ratio |
|---|
|
| Cash Flows from Operating Activities / Cash Flows from Investing Activities / Free Cash Flow |
|---|
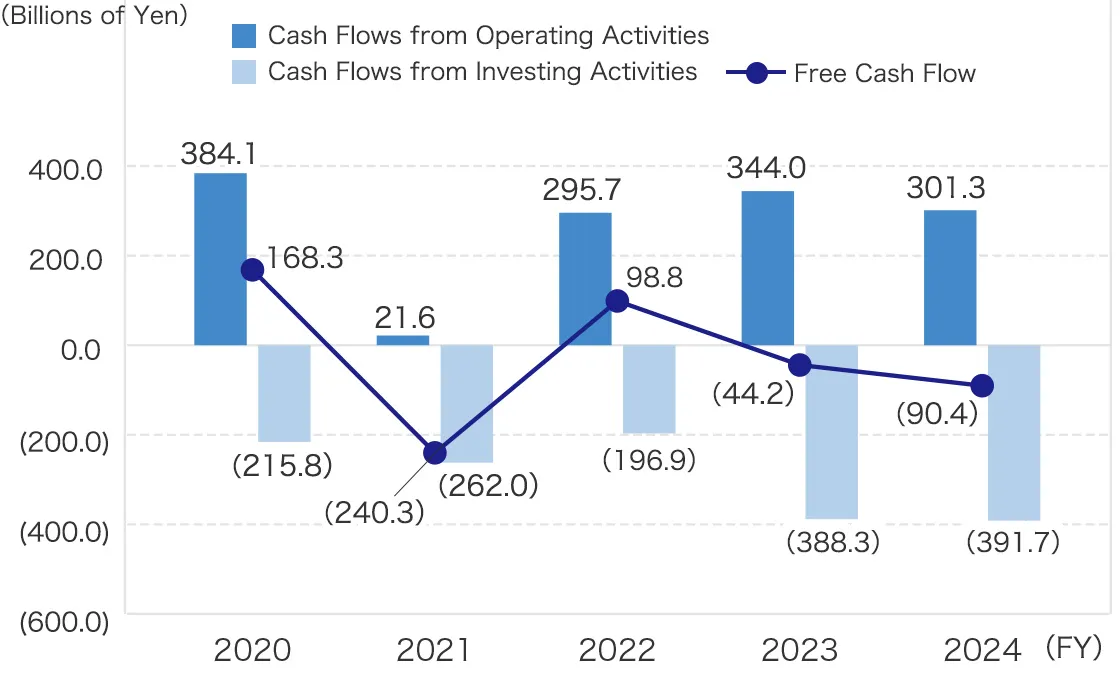
|
(Billions of Yen)
| Consolidated Financial Data | FY2020 | FY2021 | FY2022 | FY2023 | FY2024 |
|---|---|---|---|---|---|
| Operating Revenues | 2,935.4 | 2,705.1 | 3,986.6 | 3,610.4 | 3,669.2 |
| Operating Profit (Loss) | 145.6 | (53.8) | 107.0 | 343.3 | 242.0 |
| Ordinary Profit (Loss) | 192.2 | (59.3) | 65.1 | 509.3 | 276.4 |
| <Ordinary Profit excluding time lag> (Approx. Billions of Yen) | <169.0> | <67.0> | <156.0> | <371.0> | <264.0> |
| Profit (Loss) attributable to owners of parent | 147.2 | (43.0) | 38.2 | 403.1 | 202.1 |
| Total Assets | 5,686.3 | 6,174.7 | 6,455.1 | 7,108.6 | 7,124.8 |
| Shareholders' Equity | 2,031.1 | 2,017.1 | 2,060.8 | 2,585.5 | 2,786.5 |
| Outstanding Interest-bearing Debt | 2,333.6 | 2,800.2 | 2,925.7 | 3,079.1 | 3,077.9 |
Index Highlights (Consolidated)
| EPS (Earnings per Share) / DPS (Dividends per Share) |
|---|
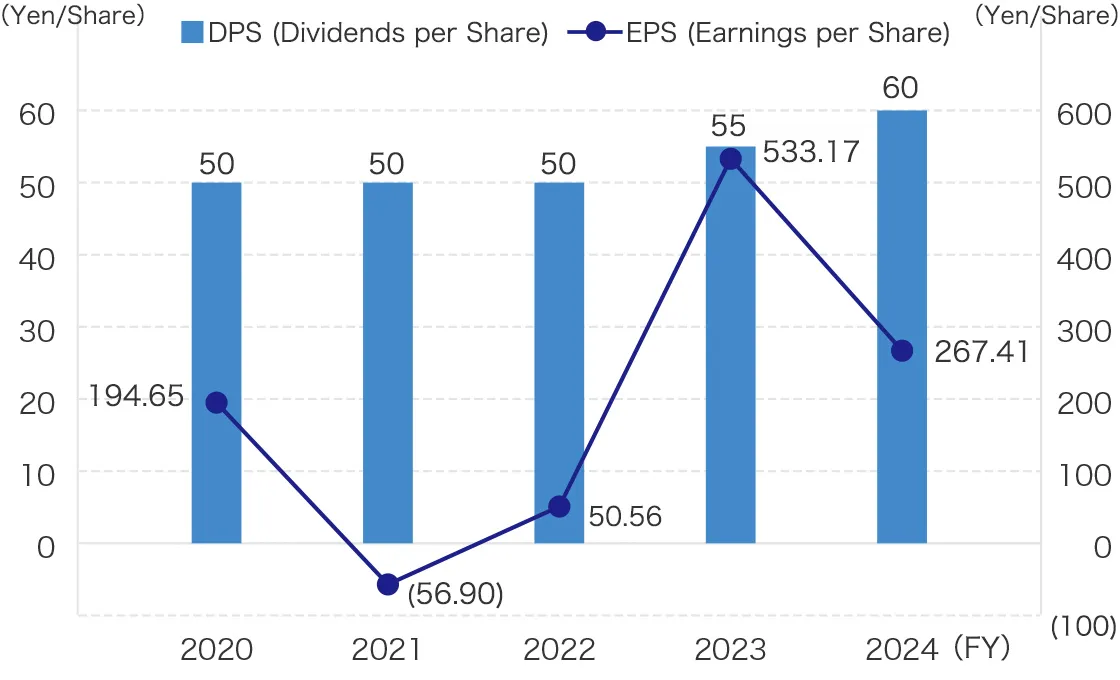
|
| TSR (Total Shareholders Return) / TOPIX including dividends |
|---|
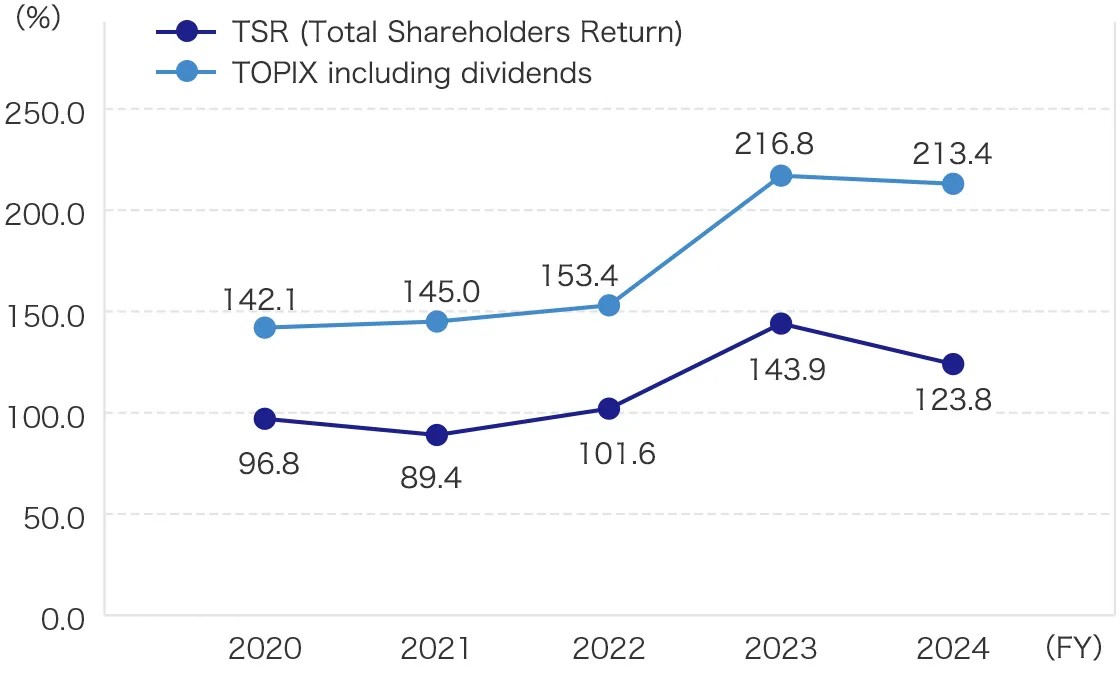
|
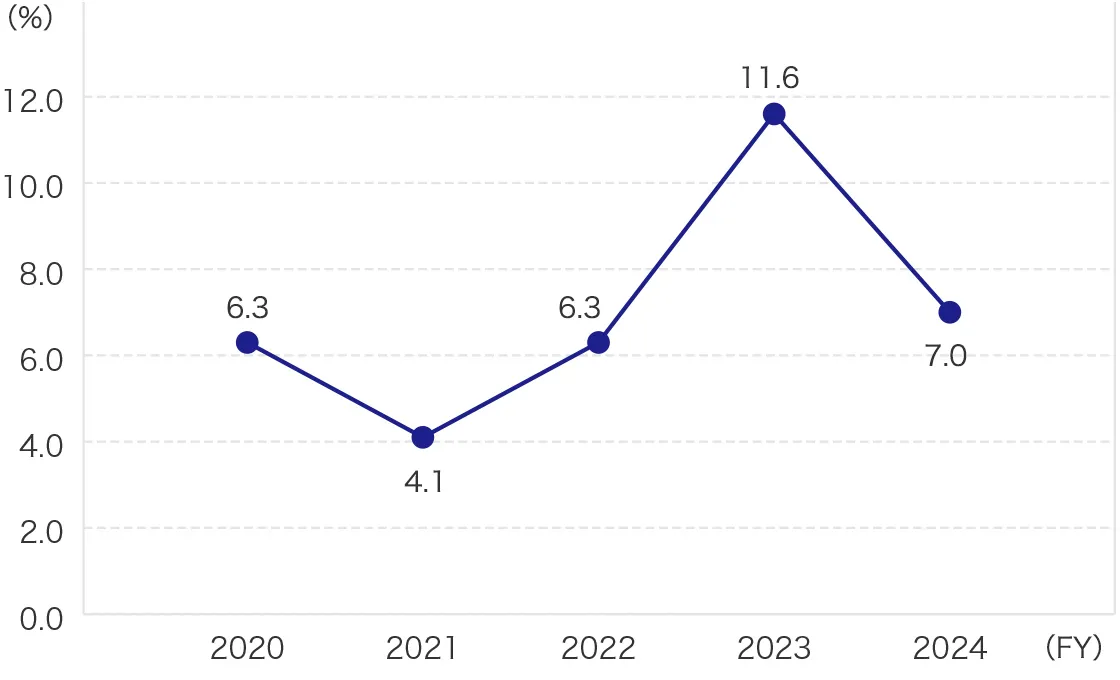
| ROA (Return on Assets) *Excluding time lag |
|---|
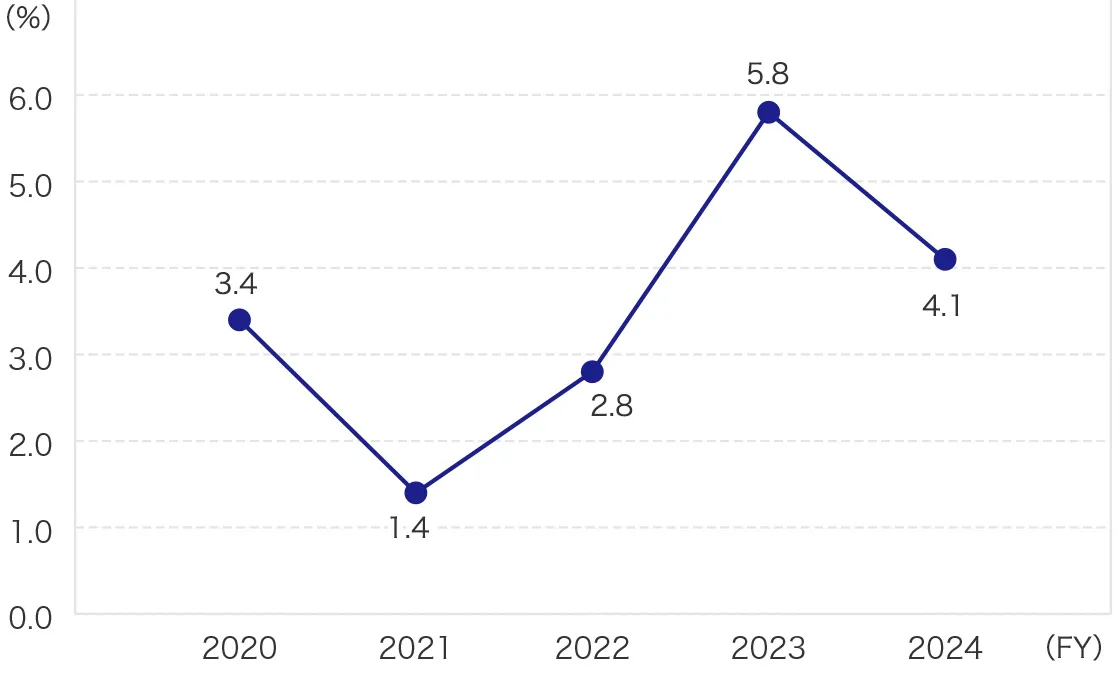
|
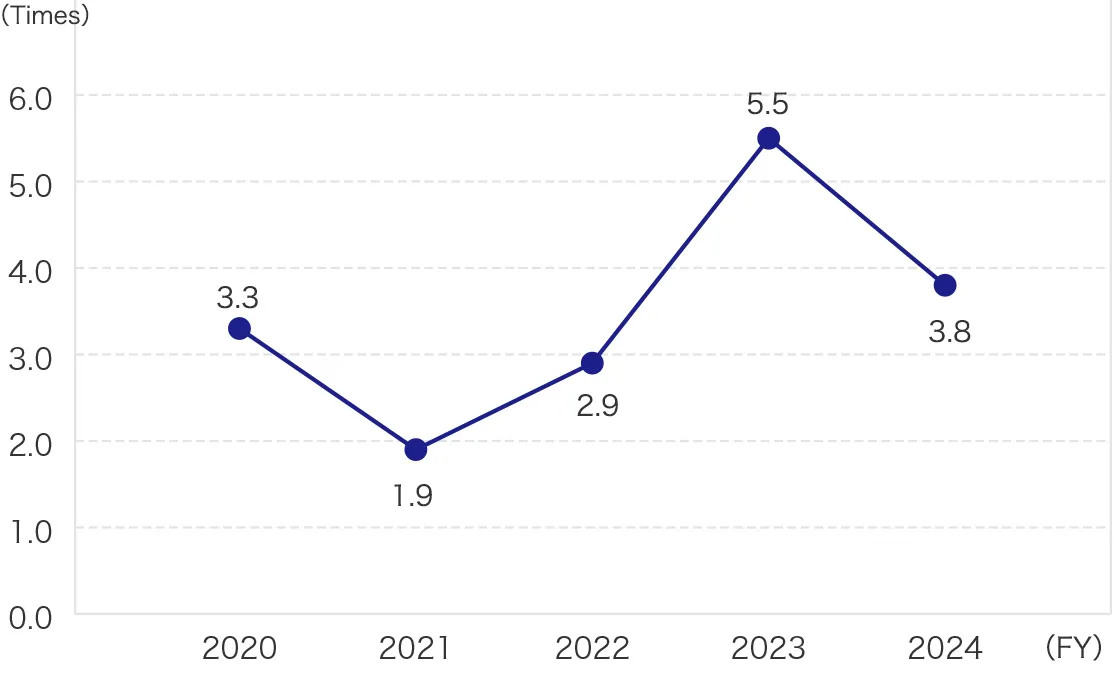
| ROE (Return on Equity) *Excluding time lag |
|---|
|
| ROIC (Return on Invested Capital) *Excluding time lag |
|---|
|
| PER (Price Earnings Ratio) |
|---|
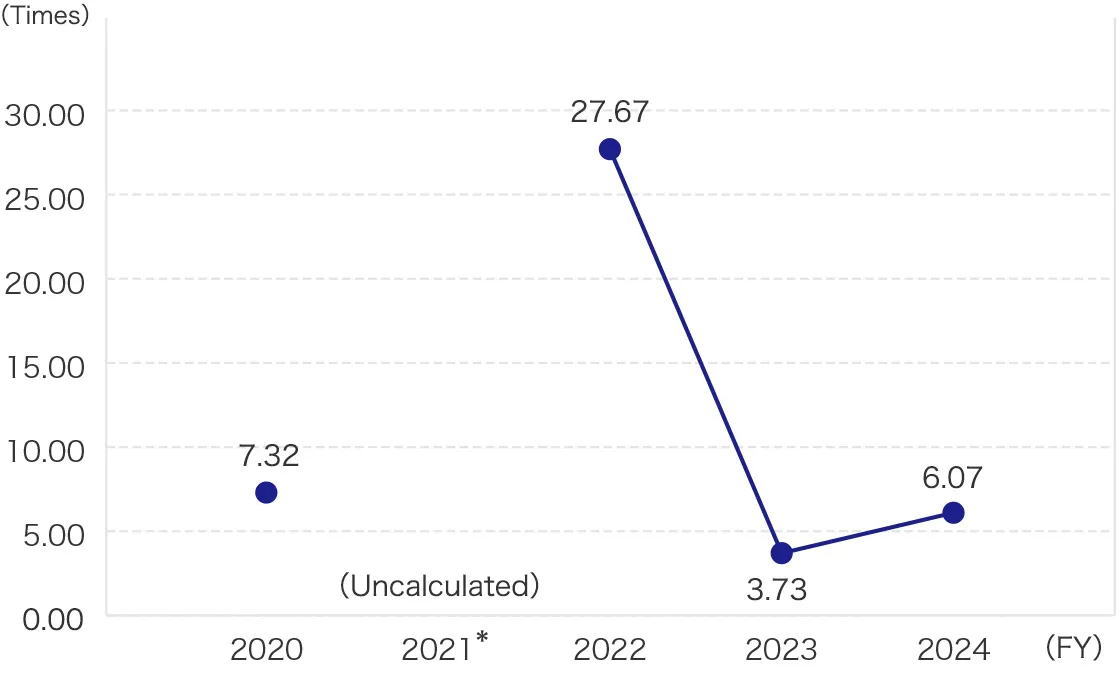
|
*PER was not calculated in which net loss was redorded in FY2021.
| PBR (Price Book-value Ratio) |
|---|
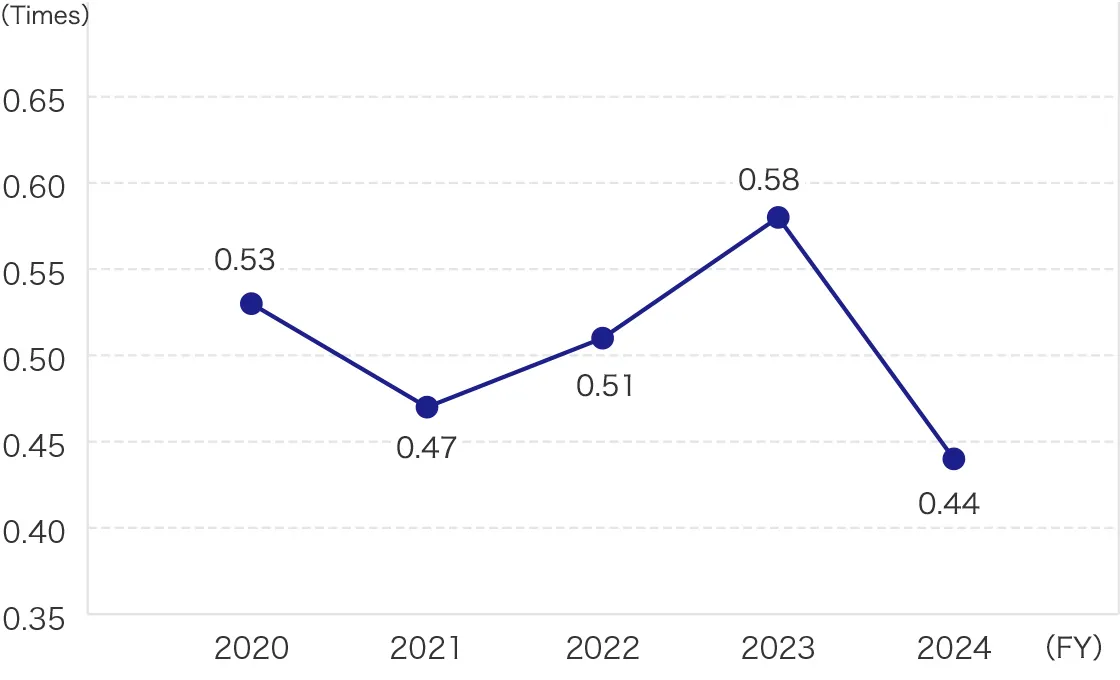
|
If you want to know in more detail, please refer to Investors' Data Book 2025.