Press Release
March 2012, FY2011 (2nd half) and FY2011 (Entire) Power Generated and Purchased (Preliminary Report)
April 09, 2012
Chubu Electric Power Co.,Inc.
Overview of March 2012
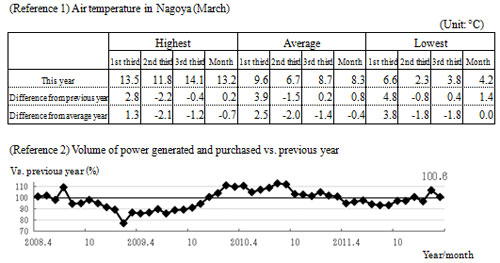
- The volume of power generated and purchased came to 100.6% the volume of the same period a year ago, showing a year-on-year increase.
FY2011 (2nd Half and Entire)
- The volume of power generated and purchased in the 2nd half of FY2011 was 100.1% the volume of the same period a year ago, showing a year-on-year increase.
- The volume of power generated and purchased in FY2011 was 97.6% the volume of the same period a year ago, showing a year-on-year decrease.
1.The volume of power generated and purchased
|
|
March 2012 |
FY2011 2nd Half |
FY2011 |
|---|---|---|---|
|
Power generated and purchased |
12,161 |
70,913 |
138,948 |
|
Internally generated power Breakdown :Hydro Power |
783 |
3,495 |
9,282 |
|
Internally generated power Breakdown :Thermal Power |
10,555 |
63,110 |
115,996 |
|
Internally generated power Breakdown :Nuclear power |
0 |
0 |
2,616 |
|
Internally generated power Breakdown :Wind power, solar power |
8 |
35 |
57 |
|
Received from other sources |
815 |
4,273 |
10,997 |
2.Maximum power monthly three-day average
|
|
March 2012 |
FY2011 2nd Half |
FY2011 |
|---|---|---|---|
|
Maximum power three-day average(% of previous year) |
21,010 |
23,290 |
25,020 |
* Calculated by taking the average from the three days within the applicable month on which the highest volume of electricity is recorded.
The maximum power three-day average for FY2011 2nd half occurred in February.
The maximum power three-day average for FY2011 occurred in August.
3.Flow rate
|
|
March 2012 |
FY2011 2nd Half |
FY2011 |
|---|---|---|---|
|
Flow rate |
121.6 |
108.1 |
111.8 |
* Flow rate = (Volume of hydro-generated electricity/Average hydro-generated electricity for past 30 years) × 100
Results greater than 100% denote high water flows; results less than 100% denote low water flows.
4.Rate of use of nuclear facilities
|
|
March 2012 |
FY2011 2nd Half |
FY2011 |
|---|---|---|---|
|
Rate of use of nuclear facilities |
0.0 |
0.0 |
8.2 |
* Hamaoka Nuclear Power Station
Reactor No. 3 operations have been suspended from Nov. 29, 2010 (periodic inspection)
Reactor No. 4 operations suspended from May 13, 2011 (periodic inspections from January 25, 2012)
Reactor No. 5 operations suspended from May 14, 2011 (periodic inspections from March 22, 2012)